Overviews
Author: Natalia Grishchenko
April 5 2026
Employment trends in the digital economy: the evidence from the EU
The digital economy offers additional new employment opportunities: remote work, additional work, part-time work, platform-based work, e-commerce, and more. Using EU countries as examples, we analyze these trends in a comparative context across countries and across years.
We find that employment trends in the digital economy are inconsistent, with significant differences in penetration levels across countries, a significant impact of the pandemic, and depend not only on the level of ICT development in a country but also on regional and national labor market patterns in general.
Against the backdrop of overall employment growth, which averaged 1.6% for the EU as a whole over 2021-2025, we see significant differences between countries in both the time series and the values of this indicator, ranging from negative values to several times higher than the EU-wide average (Fig. 1).
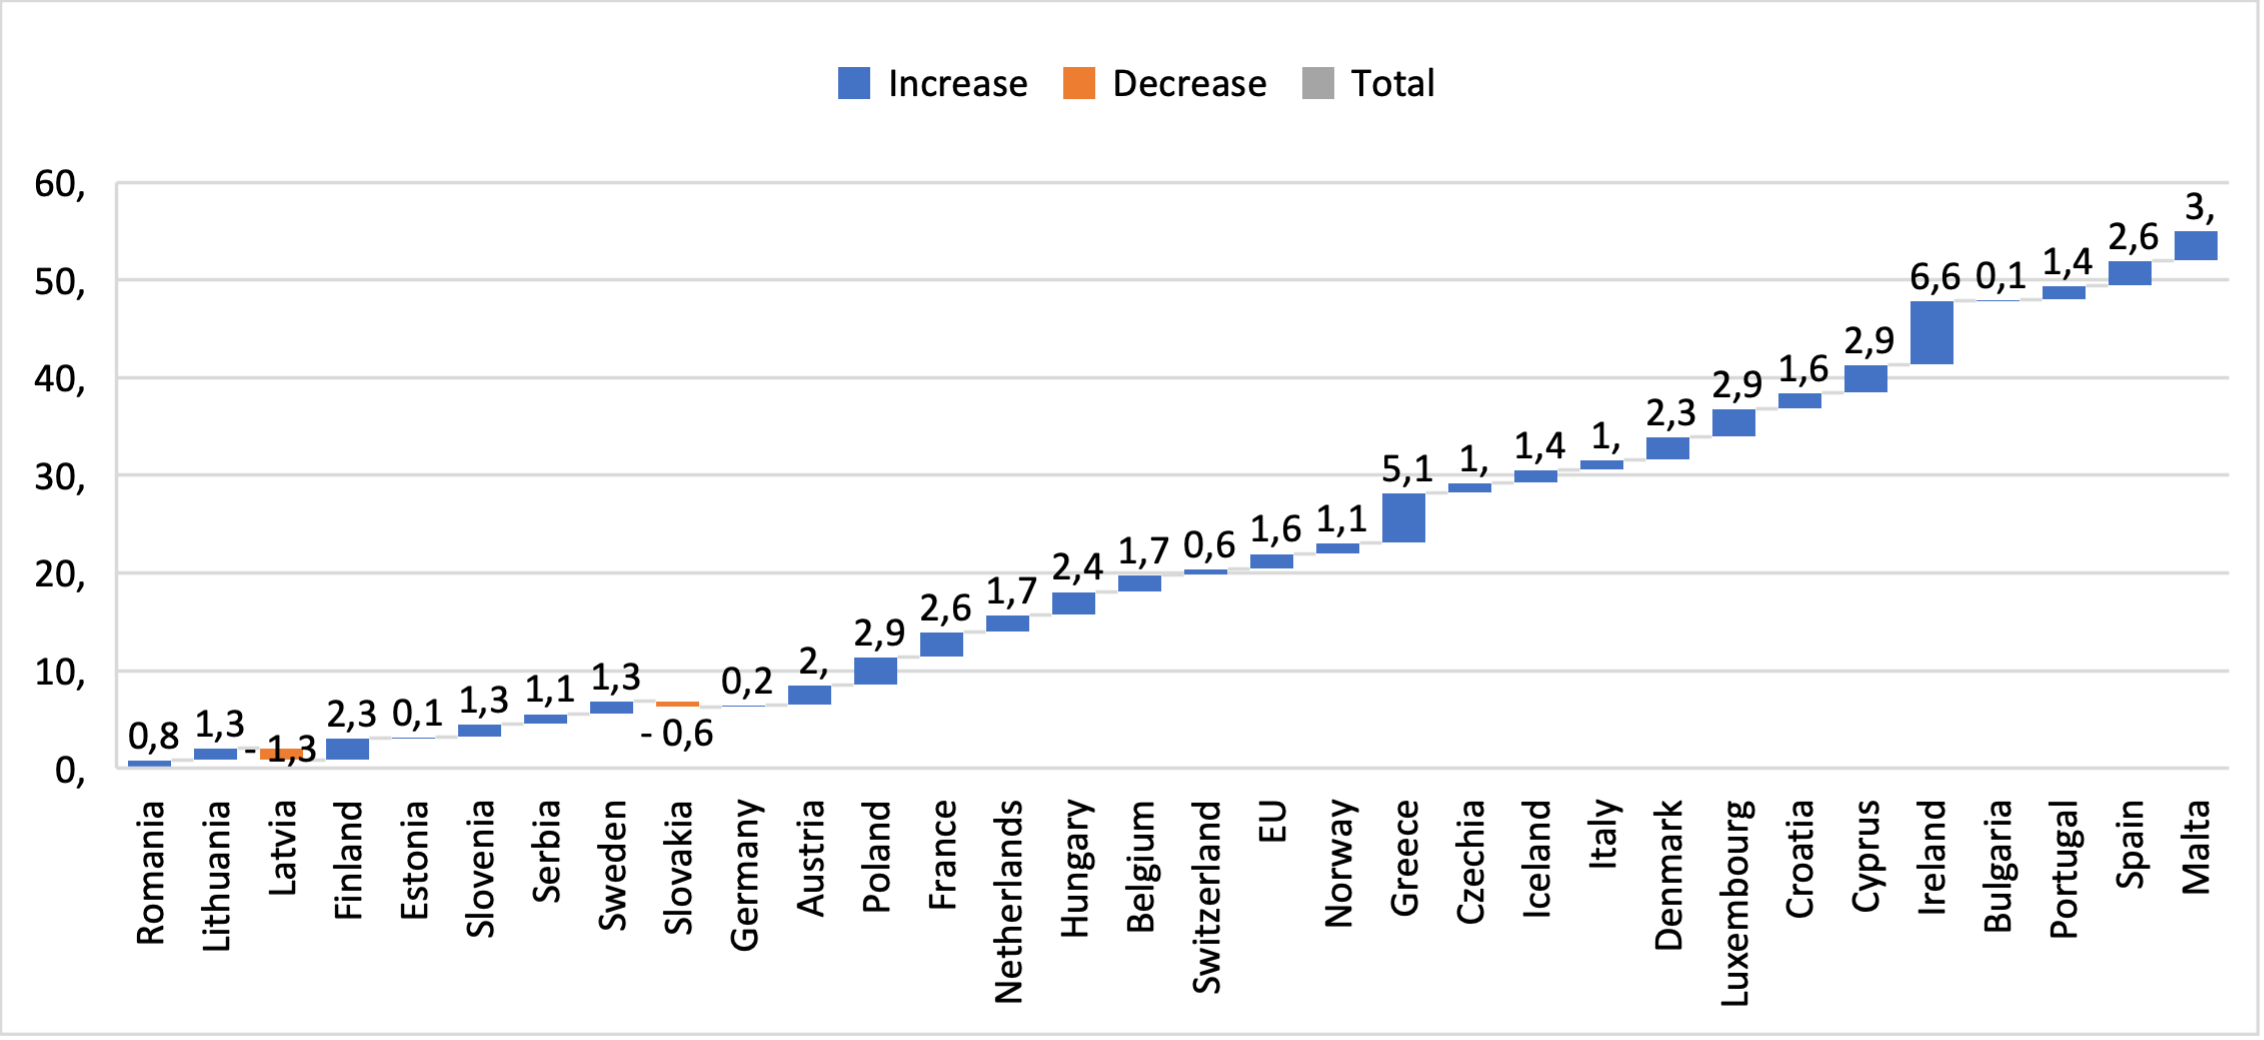
Fig. 1. Overall employment growth, 2021-2025 in the EU, the percentage of employed persons.
Source: Eurostat.
The percentage of employed persons having more than one job varies between approximately 1% and 12% across countries over 2016-2024, which may be due to the specifics of labor regulation and self-employment opportunities in different countries.
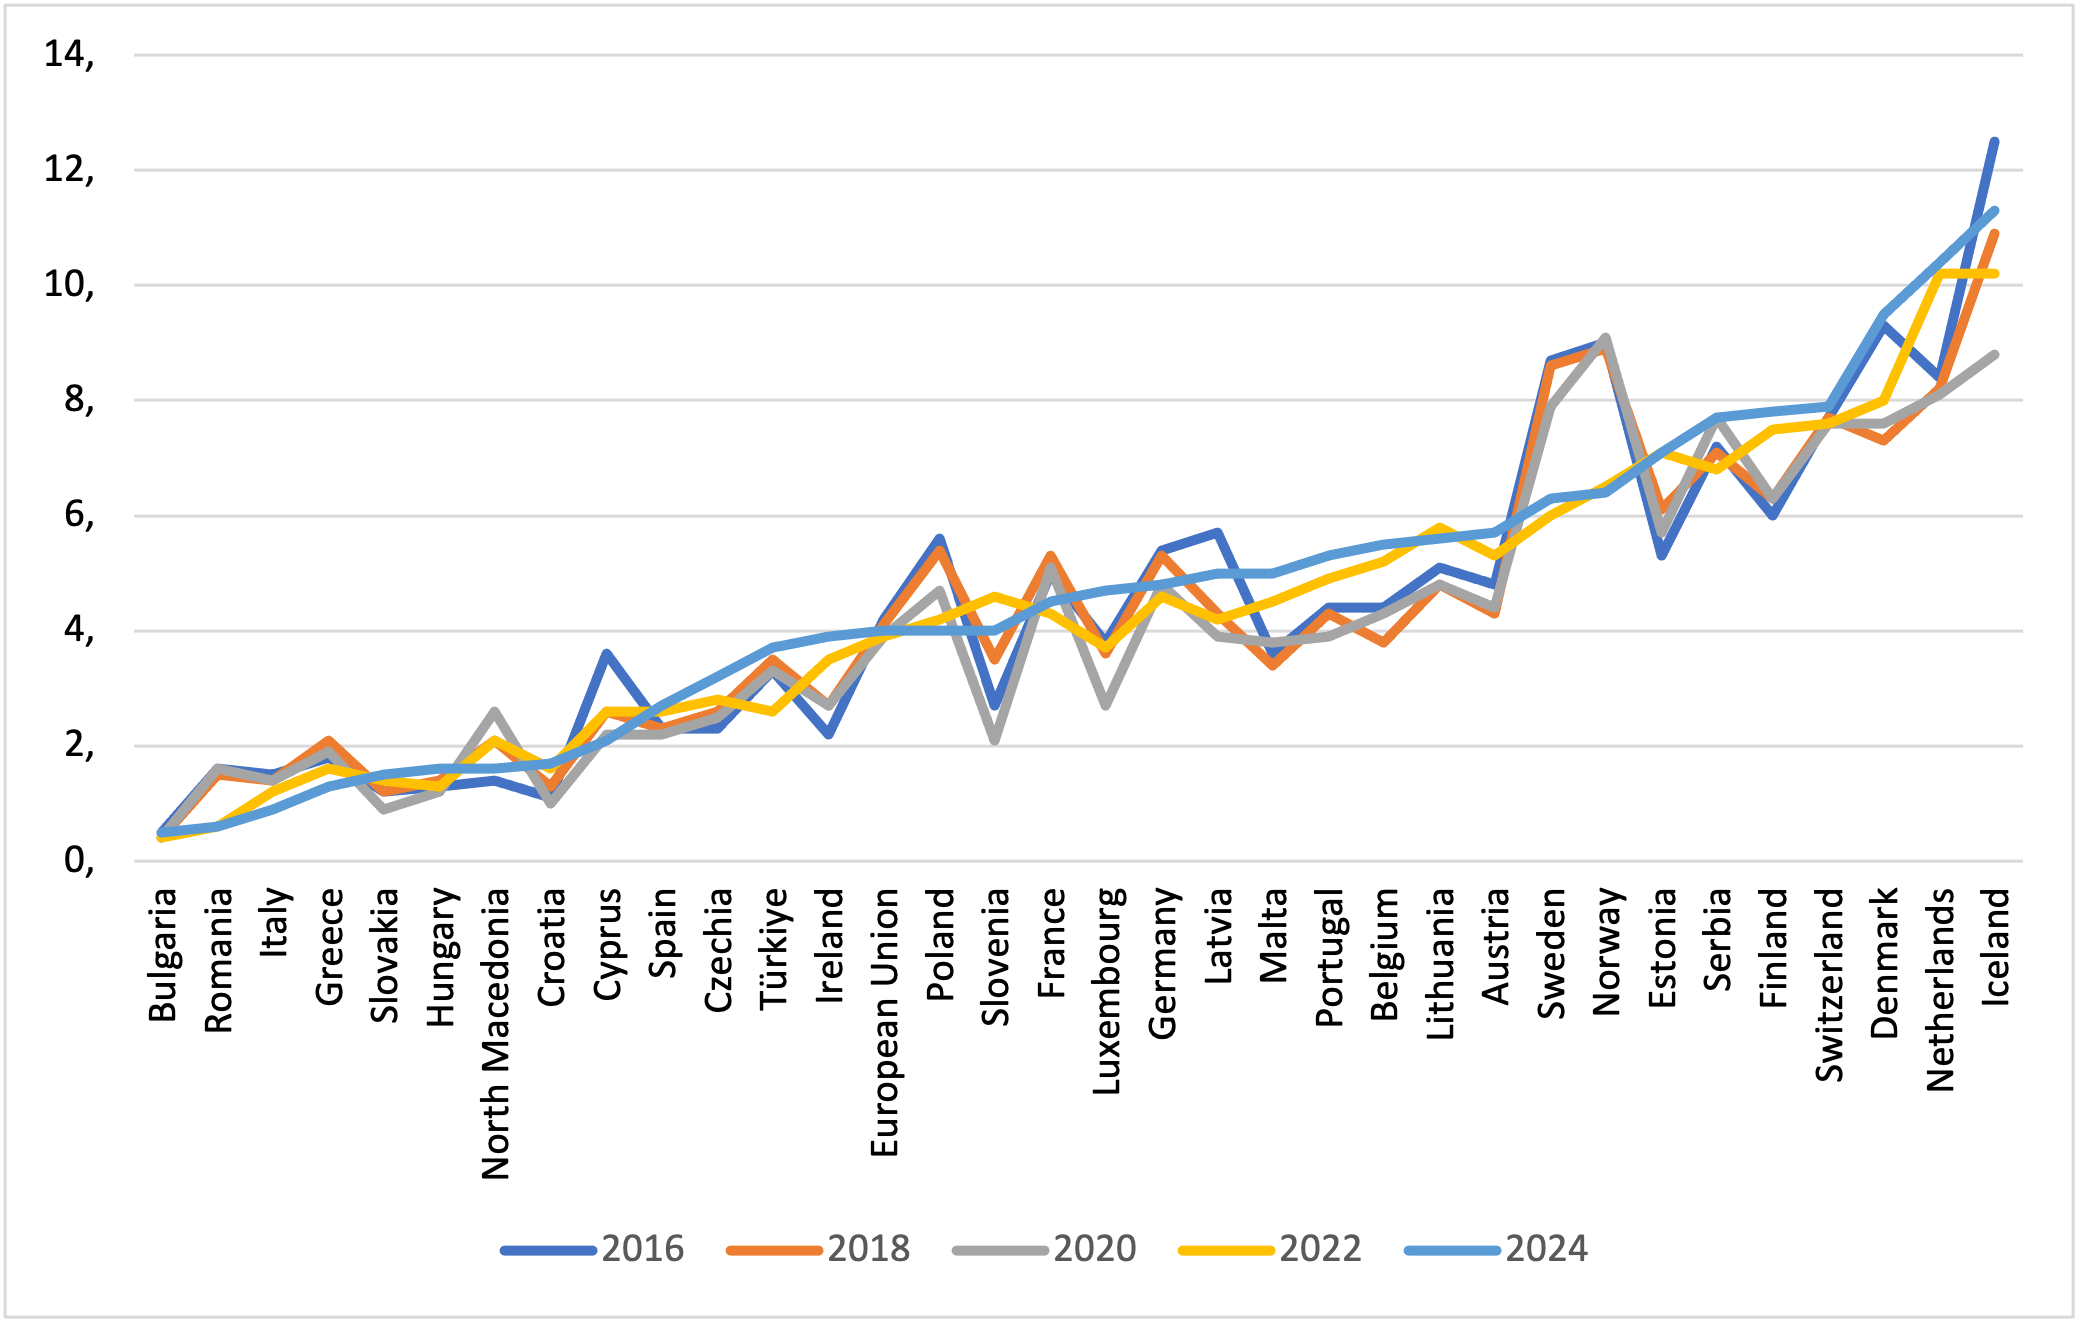
Fig. 2. Employed persons having more than one job, percentage of persons with more than one job as a share of all persons in employment, 2026-2024.
Source: Eurostat.
When assessing the part-time employment rate as level of over- or underemployment, the variation is similar, ranging from 2% to 40%. This trend is more strongly influenced by many factors, including digital opportunities, but also others: from the situation in national and local labor markets to the development of platform’s employment and self-employment in each country.
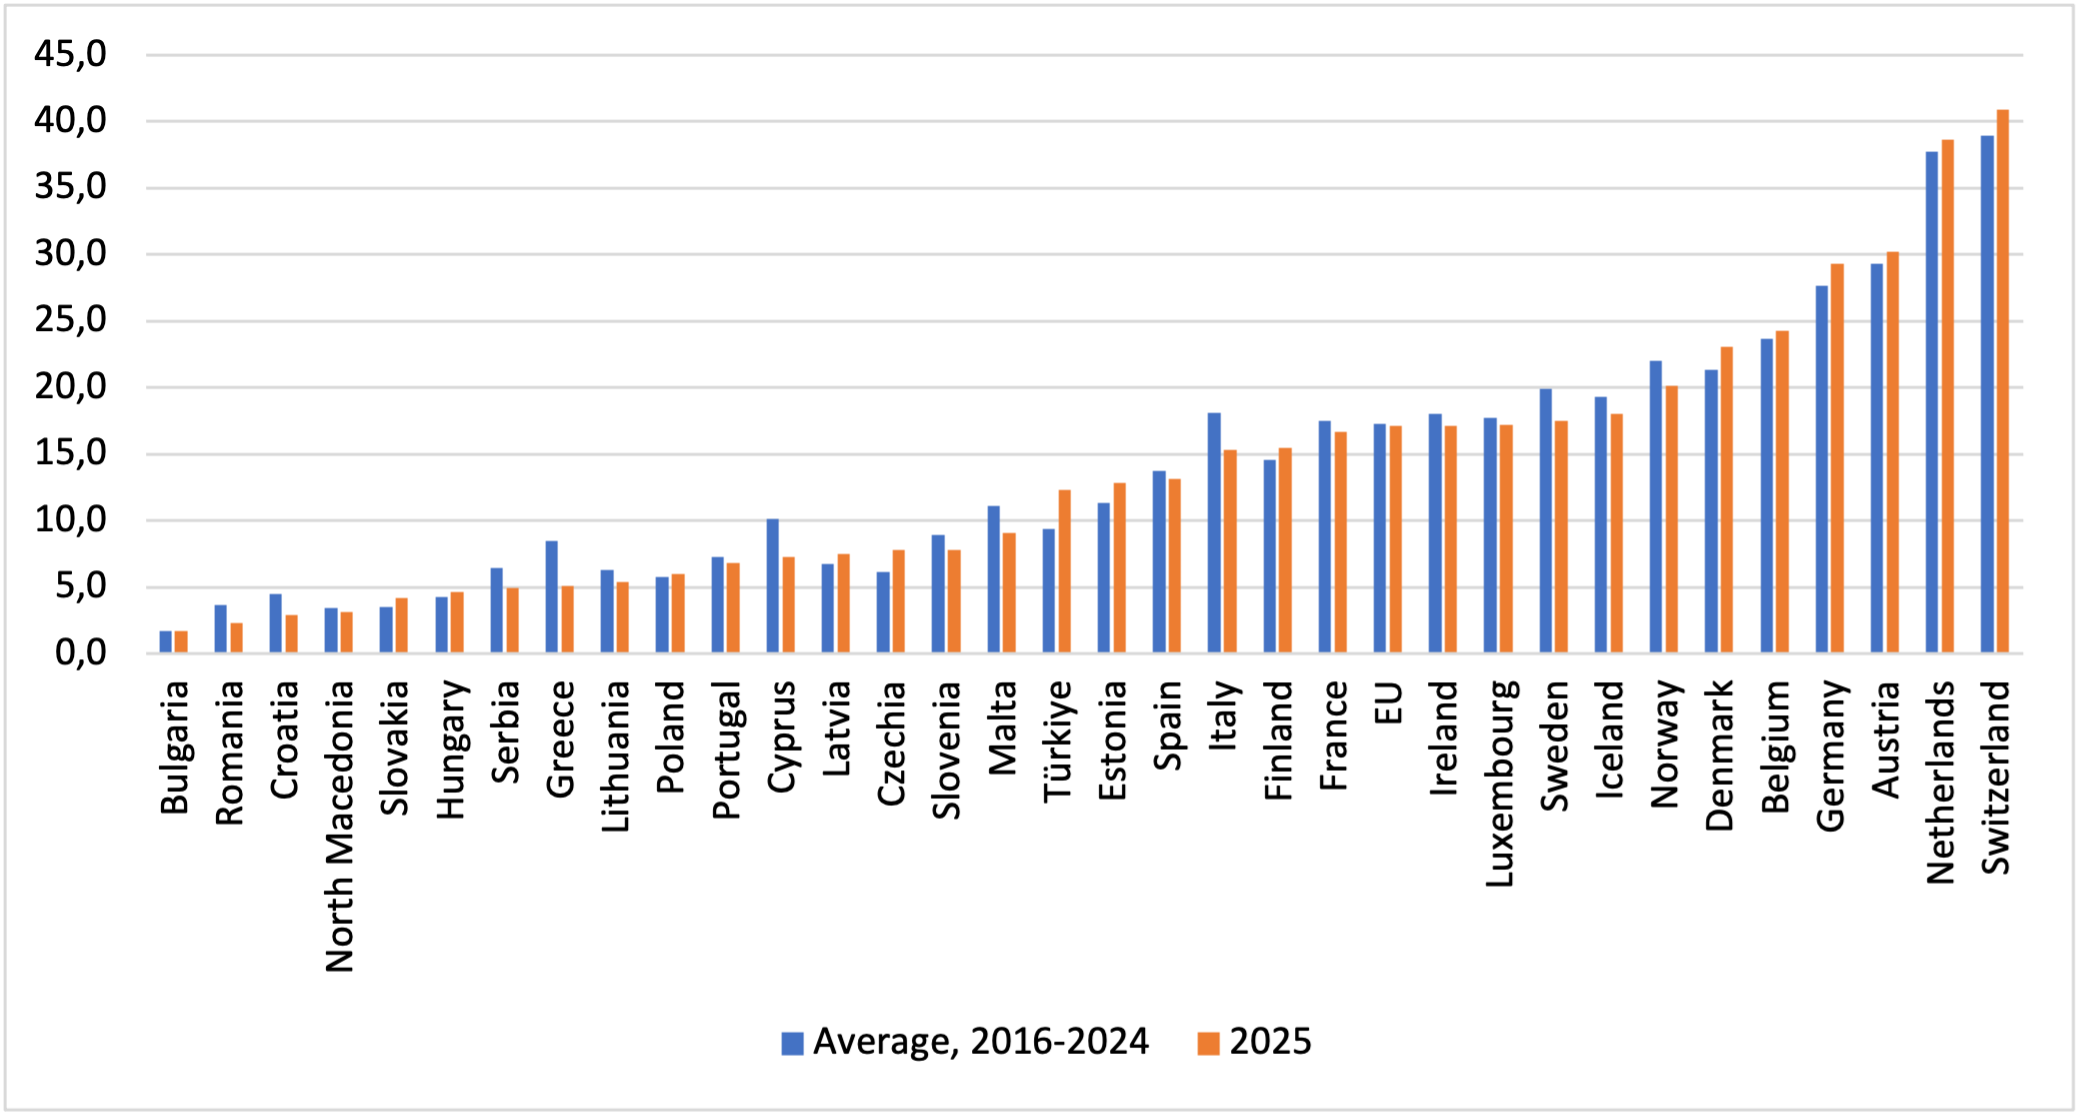
Fig. 3. Part-time employment rate, 2016-2024, 2025.
Source: Eurostat.
The EU average for employed adults working from home has fluctuated: from 4.5% in 2015 and peaks in 2020-2022 (due to COVID-19 limitations) of 10.3%, 12.4%, and 11.11%, to a stable level of 10% in 2025.
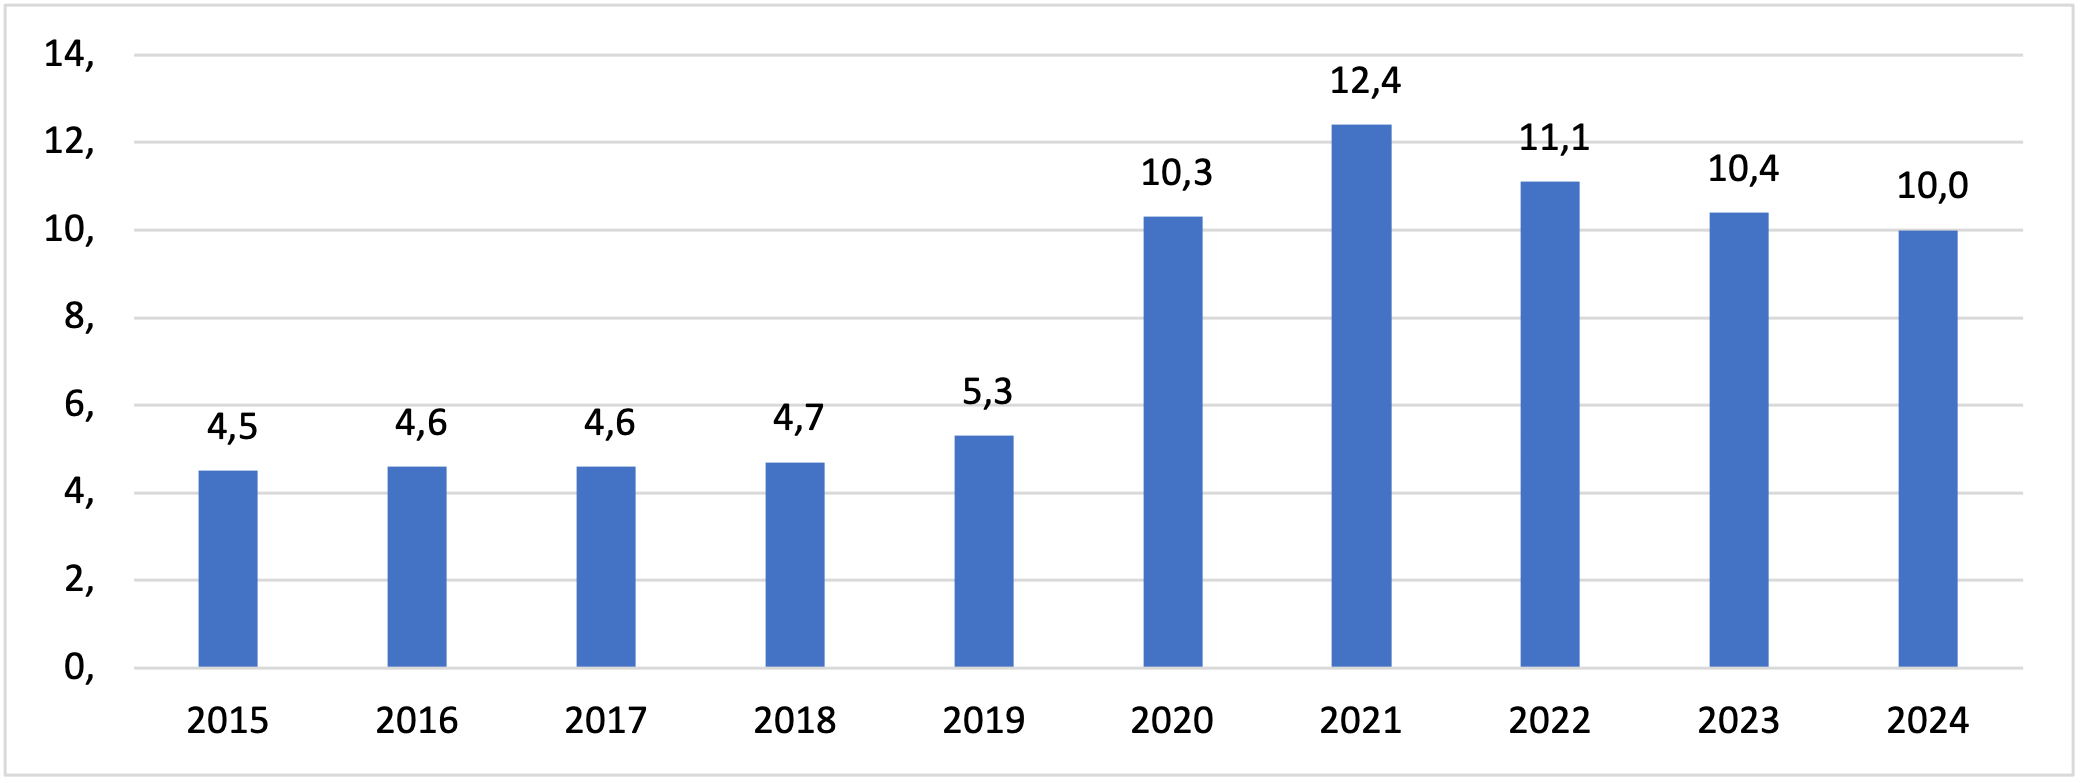
Fig. 4. Percentage of employed adults working from home, average EU, 2015-2025.
Source: Eurostat.
The share of temporary employees as percentage of the total number of employees also fluctuates between 2% and 20%, with the EU average being 11.5% in 2025.
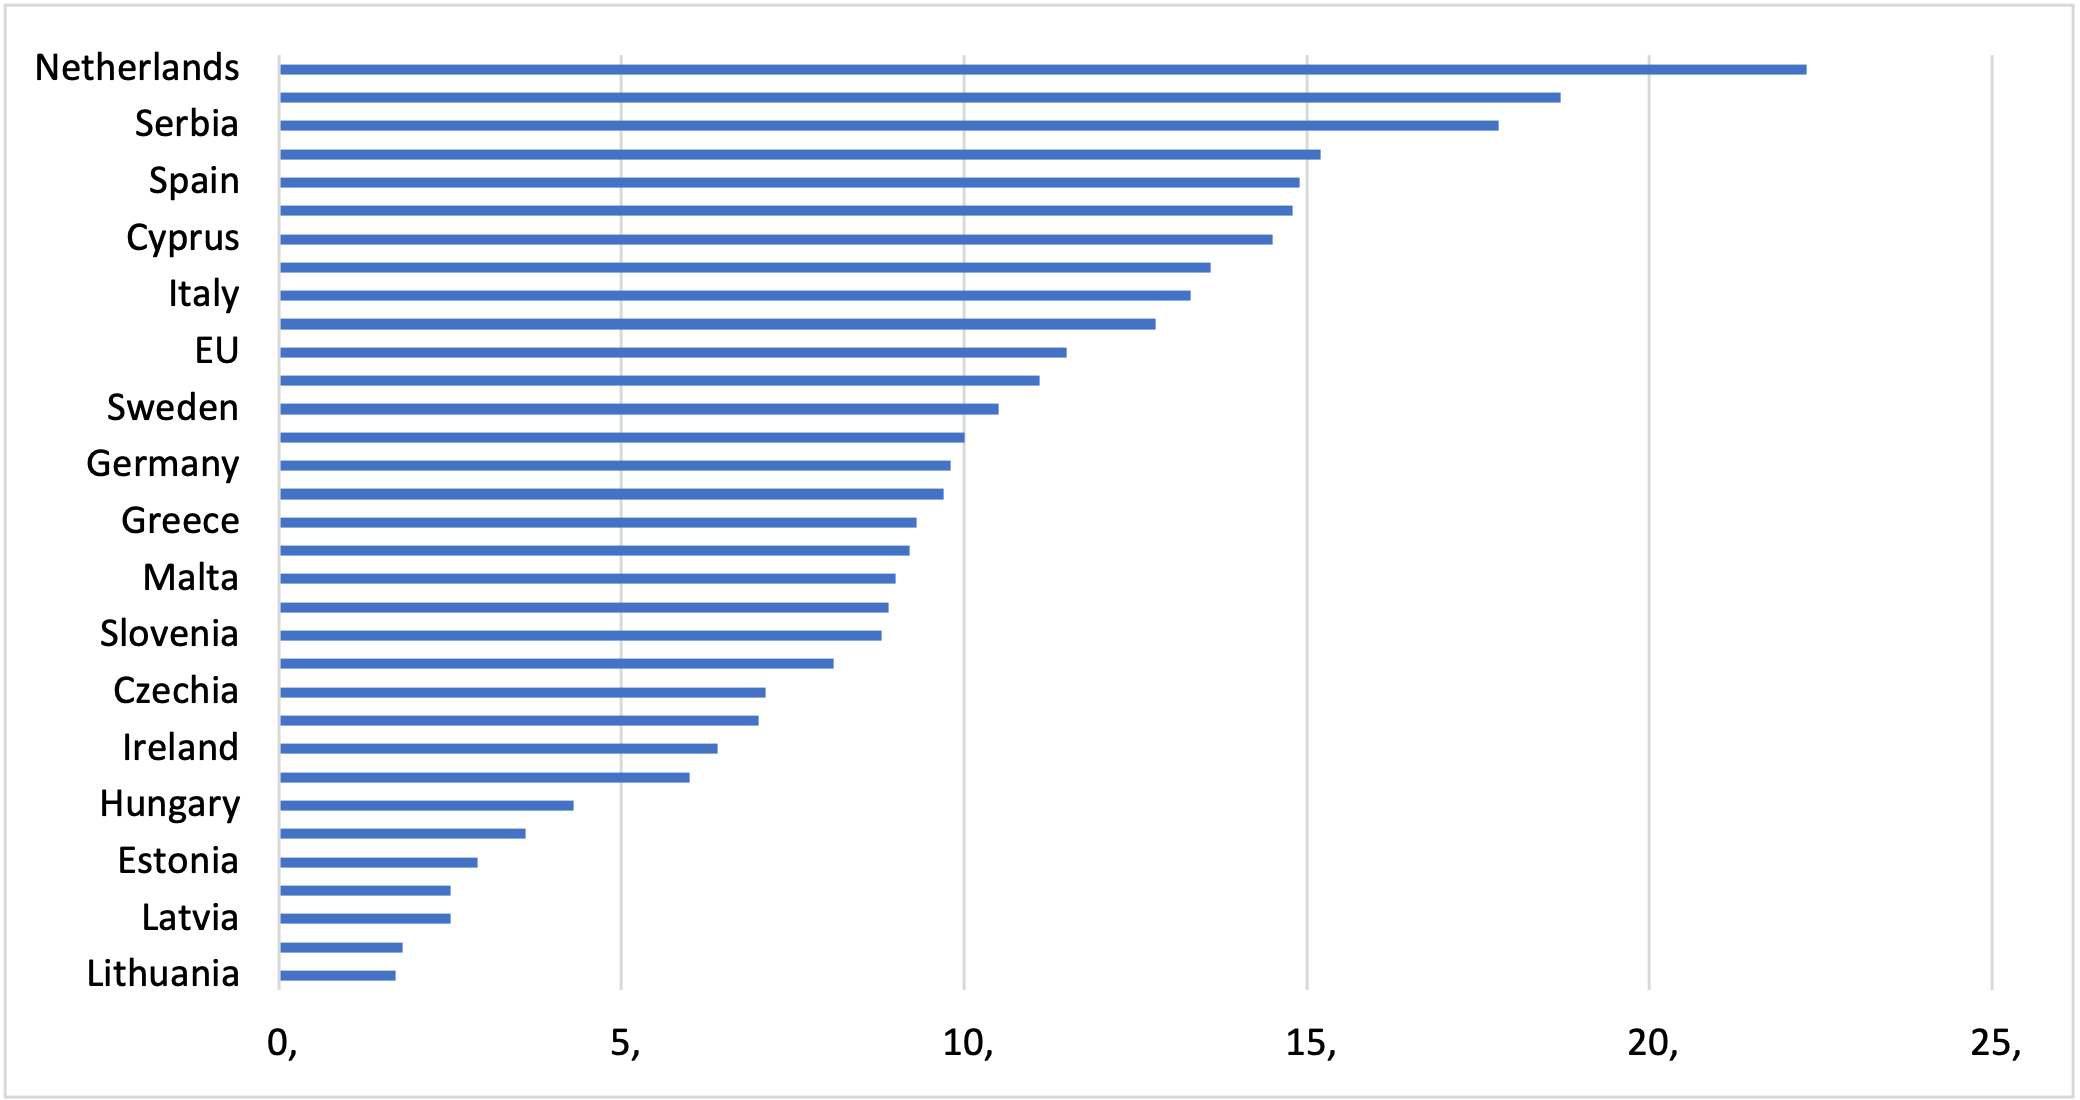
Fig. 5. Temporary employees as percentage of the total number of employees, 2025.
Source: Eurostat.
The following short conclusions can be drawn:
- Taking these differences into account across the observed indicators, we conclude that not only the development of ICT and the digital economy, but also national regulations and spatial labour market patterns exert a primary influence on employment trends.
- Stable spatial labour market patterns are characterized by polarization between countries in the South-East and North and the central part of the EU.
- The impact of the COVID-19 pandemic led to an increase in remote working, a trend that proved largely temporary and subsequently stabilized at a moderate annual increase.
- The level of ICT penetration and the development of the digital economy, characterized by digital divides or inequalities, can influence employment inequality.
- Labour regulations regarding freelancing and self-employment in a country are one of the determining factors in the development of this employment.
Citation:
Grishchenko Natalia. Employment trends in the digital economy: the evidence from the EU. https://accorde.pl, 2026.04.05.